
QUIZ-2_Week-2_FSAWRP: Check for understanding:
Quiz Summary
0 of 5 Questions completed
Questions:
Information
You have already completed the quiz before. Hence you can not start it again.
Quiz is loading…
You must sign in or sign up to start the quiz.
You must first complete the following:
Resultados
Resultados
Your time:
Time has elapsed
Categories
- Not categorized 0%
-
TRY AGAIN
-

This week we learned about how to calculate the control limits in a real process based on the historical data measurements. Additionally, we connect the concepts of central tendency and variability in order to identify process conditions. Now you are able to make your own control chart and apply this simple context in different scenarios during the wastewater and water treatment processes.
- 1
- 2
- 3
- 4
- 5
- Current
- Review
- Answered
- Correcto
- Incorrect
-
Pregunta 1 of 5
1. Pregunta
According to the normal distribution, if we move 1 respect to the mean, what percentage of data lays on this range?:
-
Pregunta 2 of 5
2. Pregunta
If you pretend to calculate the confidence interval (ULC) or (LCL), what is the most appropriate value of Z?
-
Pregunta 3 of 5
3. Pregunta
According to the theory, the expression
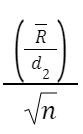
is used when the replication for each group is:
-
Pregunta 4 of 5
4. Pregunta
According to the following control chart we can conclude
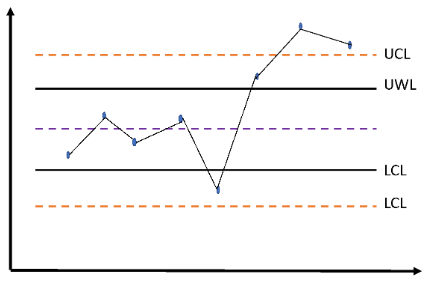
Note: data was collected each month.
-
Pregunta 5 of 5
5. Pregunta
Match the word to its meaning
Drag and Drop
- Accurate
- Precise
- Accurate and precise
-
It refers to how close a sample measurement is to the actual population value
-
It is the degree to which repeated measurements achieve the same results under unchanged conditions.
-
A certificate laboratory must ensure that all the results are: